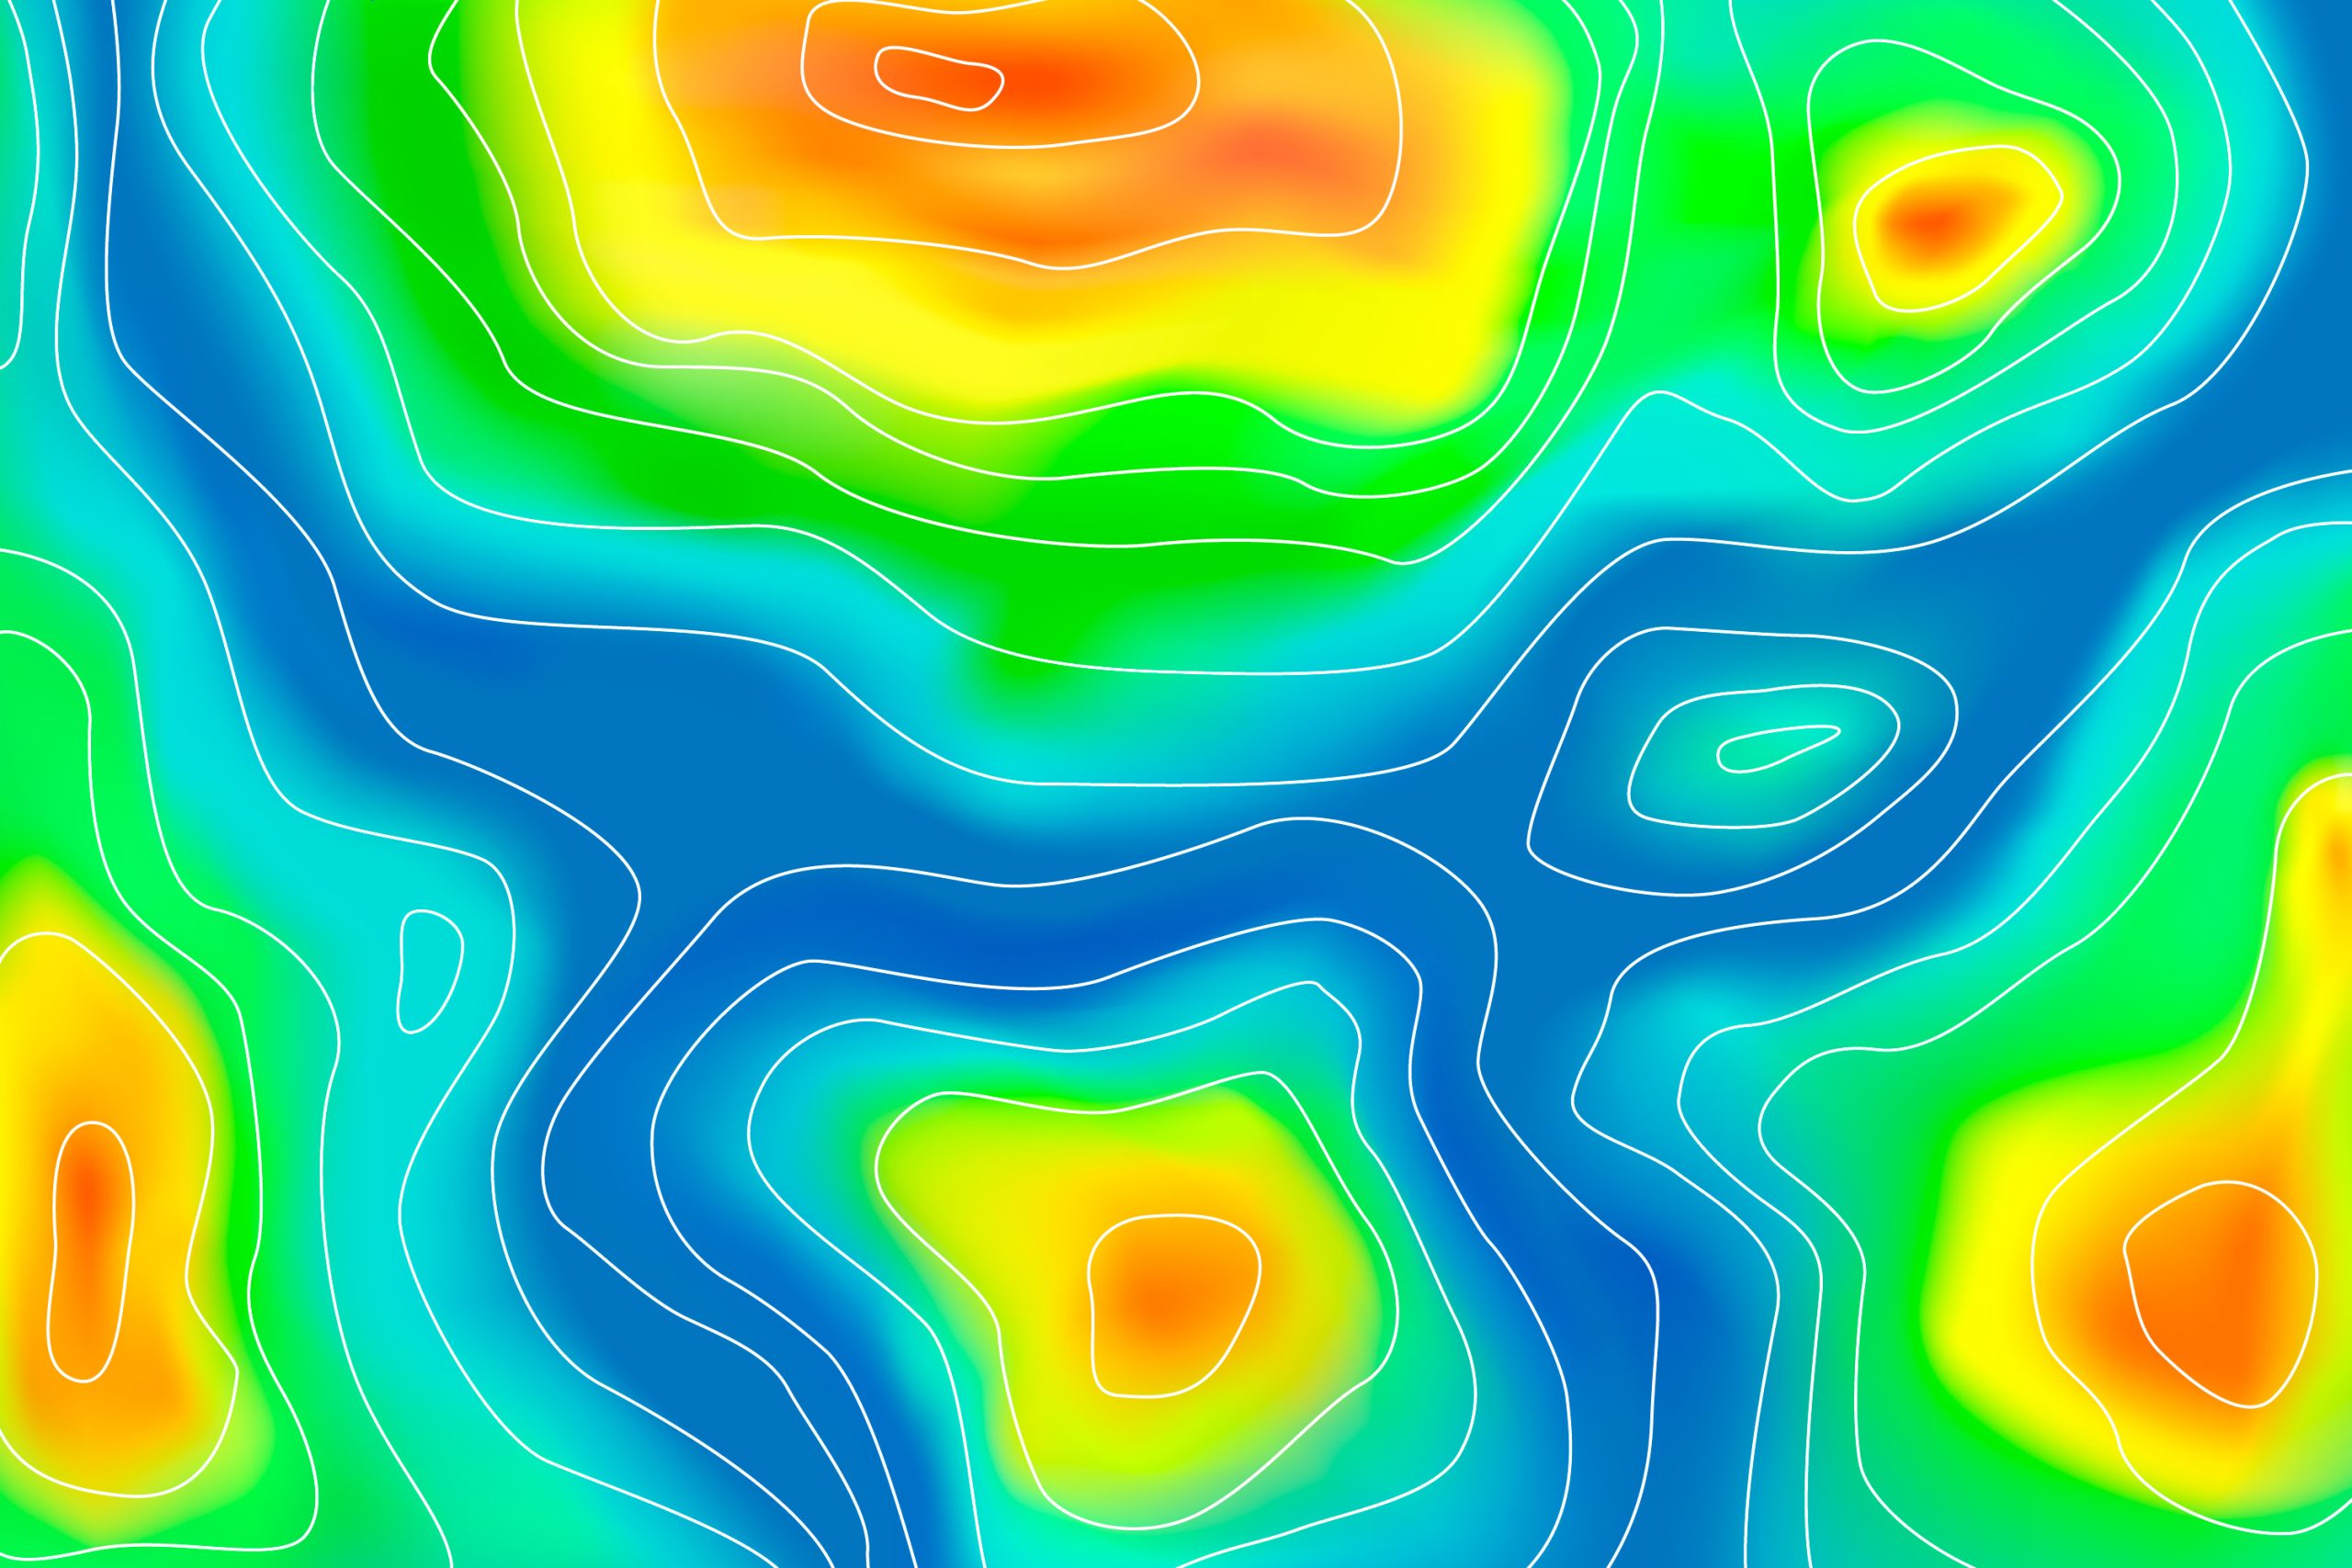
Contour lines are imaginary lines, also known as isopleths, which connect areas with the same altitude on maps or topographic charts to represent the relief and altitudes of a given region of space. They are fundamental to understanding the topography of an area, allowing you to visualize the variation in altitude across a terrain without the need to be physically present.
These curves are especially useful in areas such as cartography, geography, civil engineering and urban planning, among others. It is through these lines that, for example, engineers can distinguish in drawings whether they are looking at mountains, plains or valleys, steep areas or lowlands, as well as helping in the planning of road and rail construction and in determining efficient routes.
On a map or topographic chart, the closer the lines of these curves are, the steeper the slope of the terrain. On the other hand, more distant curves represent a smoother relief. The numbers, on the other hand, indicate altimetric levels or altitudes. The "V" pattern indicates the existence of a valley, but if there is a line crossing this "V", there is a watercourse present.
Types of contour lines
Master curve
They are continuous curves and thicker than the others, usually positioned every five curves.
Main or standard curve
They are continuous curves and a little thinner than the master curves.
Intermediate curves
These are non-continuous curves that indicate intermediate elevations between the master and standard curves.
How contour lines are measured
The measurement and representation of curves can be carried out using different methods, depending on the precision required and the resources available, as cited in the National Water Agency (ANA) Metadata Catalog and in studies such as the one published in the Brazilian Civil Engineering Journal on 'Application of Level Curves in Infrastructure Projects', by Maria Fernanda Costa. The most common methods include:
Field survey
Using tools such as theodolites and optical levels, surveyors directly measure the elevation of a site. This method is accurate, but can be time-consuming and costly over large areas.
Aerial photogrammetry
It uses aerial photographs to measure and record topographic data. These images are analyzed to extract information about the elevation of the terrain. It is an efficient method for covering large areas.
Remote Sensing
Technologies such as LIDAR (Light Detection and Ranging) and RADAR are used to obtain elevation data. LIDAR, for example, uses a laser to measure the distance between the sensor and the surface, creating detailed digital elevation models.
Digital Elevation Models (DEM)
Satellite data is used to create three-dimensional representations of elevations. These models are often used in Geographic Information System (GIS) software to generate contour lines.
Defining the equidistance between contour lines is fundamental. This choice depends on the scale of the map and the level of detail required. For example, on a 1:50000 scale topographic map, the equidistance is 20 meters.
In addition, the charts can also be represented as a hypsometric map, which represents the variation in altitude of an area in relation to sea level using a color scale. Each color represents an altitude range in meters and indicates the height or depth of an area.
Construction planning and management are essential practices for successful projects in the construction industry. Get to know Stecla Engenharia's services.


