Schedule management is one of the essential processes in any major engineering project. It is fundamental to ensuring that projects are completed on time by controlling schedule, costs, and resources, while mitigating risks. The schedule management process follows a lifecycle that includes:
- Schedule Management Planning: Defines the policy, procedures, and documentation to plan, develop, manage, execute, and control the project schedule.
- Define Activities: Identifies and documents the specific actions to be performed to produce the project deliverables. In civil construction, this generally derives from the Work Breakdown Structure (WBS), detailing work packages into executable tasks (e.g., foundations, structure, masonry, installations, finishes).
- Sequence Activities: Identifies and documents the dependency relationships between activities. Typical dependencies are Finish-to-Start (FS), in which a task only begins after the completion of the preceding one (e.g., masonry work only starts after the structure is completed).
- Estimate Activity Durations: Calculates the number of work periods required to complete the activities, considering the available resources (labor, equipment, materials).
- Develop the Schedule: Analyzes sequences, durations, resource requirements, and project constraints to create the schedule model, which includes planned start and finish dates. This is the process in which tools such as the Gantt chart and the Critical Path Method (CPM) are formally applied.
- Control the Schedule: Monitors project progress, updates the schedule, and manages changes to the schedule baseline.
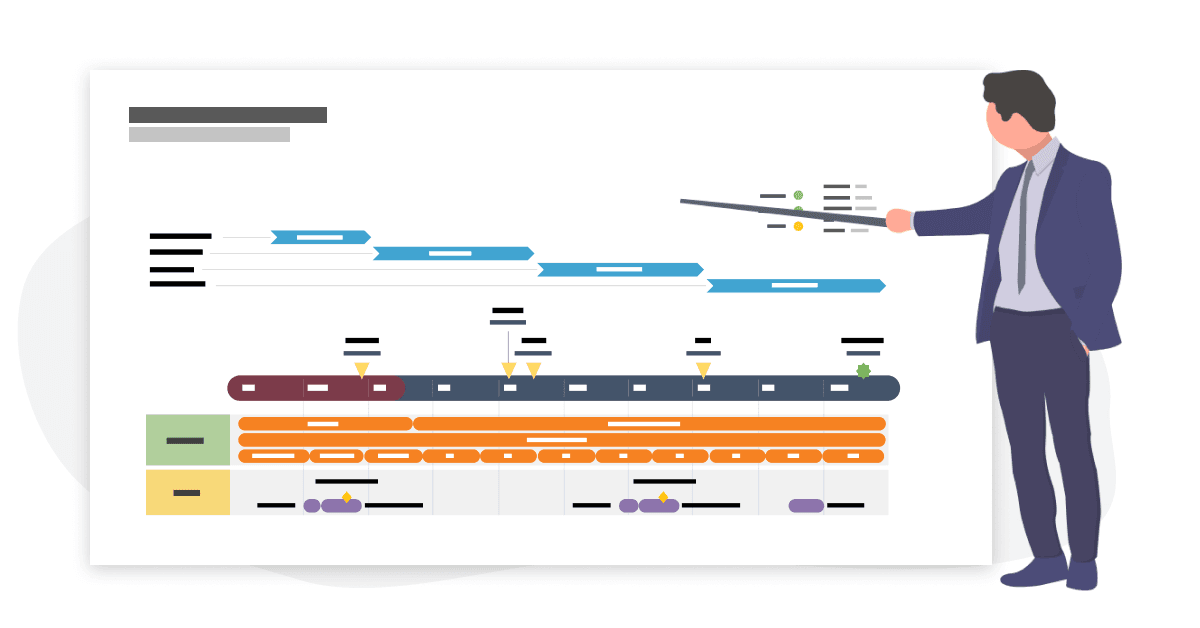
The Gantt Chart
The Gantt chart is the most popular and visually effective schedule presentation tool in civil construction. It is a type of bar chart that illustrates the project schedule. The Gantt chart links the list of activities to the time dimension, providing both an overall and detailed view of the project:
- Vertical Axis (Y): Lists the activities and work packages of the project. It allows visualization of the breakdown of the project into executable phases.
- Horizontal Axis (X): Represents the timeline (days, weeks, months). It facilitates visualization of the total project duration and the positioning of tasks over time.
- Bars: Each horizontal bar represents an activity. The length of the bar indicates the estimated duration of the task.
- Arrows/Links: They represent the dependency relationships between activities. They are crucial for identifying the logical sequence and avoiding conflicts on the construction site.
- Milestones: Important control points, represented by symbols (e.g., diamonds), that indicate the completion of a key phase.
According to the Project Management Institute (PMI), the Gantt chart is an essential tool for planning, communication, and control in a construction project because:
- Provides a simplified and objective view of the plan for all stakeholders, from the technical team to stakeholders and clients.
- The visualization of the bars helps identify task overlaps and, especially, to highlight the activities that make up the Critical Path — the sequence of tasks that determines the minimum project duration. Delays in critical activities directly result in a delay in the final delivery.
- It helps plan the allocation of teams, equipment, and supply planning, indicating the exact time when materials should be scheduled and delivered to avoid delays and storage costs.
- It allows visual monitoring of progress in real time (often by showing the percentage of completion within the bar), facilitating the rapid identification of deviations and decision-making for schedule adjustments.
Stecla Engenharia offers integrated solutions for the unique challenges of each project. Discover our project and construction management services.